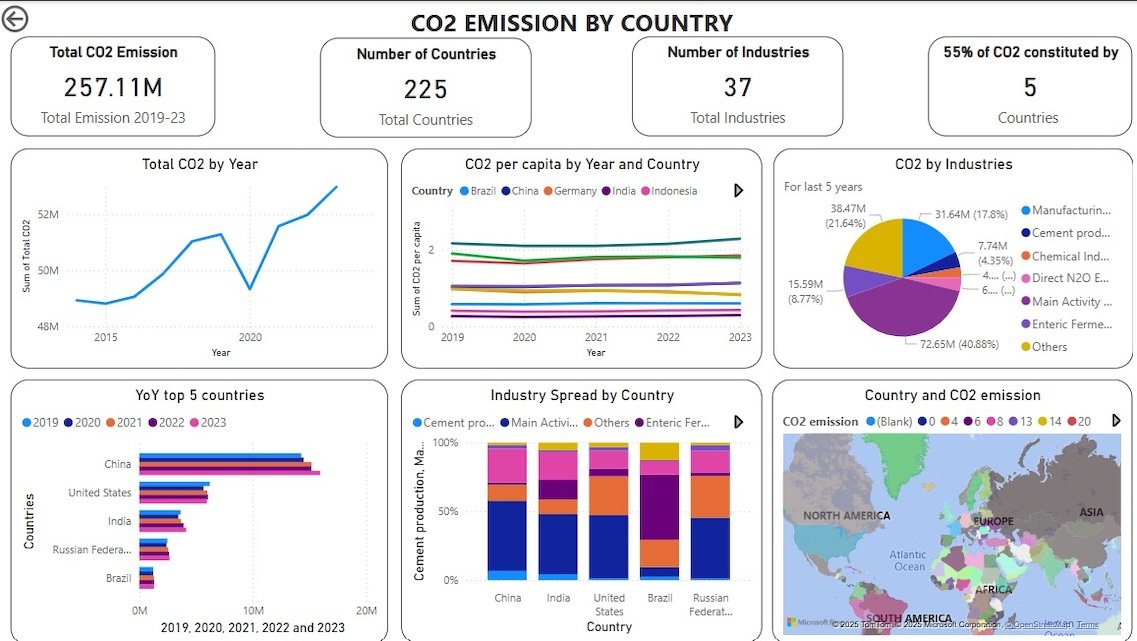
Created an interactive dashboard in Power BI to visualize CO2 emissions by country. The project involved gathering and cleaning the emission data, and then creating visualizations such as line and bar charts to analyze trends, patterns, and comparisons of CO2 emissions across different countries. The project aimed to provide insights into global emissions and track changes over time.